How Ocean Height Reveals Hidden Heat
Warm water takes up more room. That is why NASA can track El Niño's heat from space by measuring how high the sea stands, and why this October looks a lot like 1997.

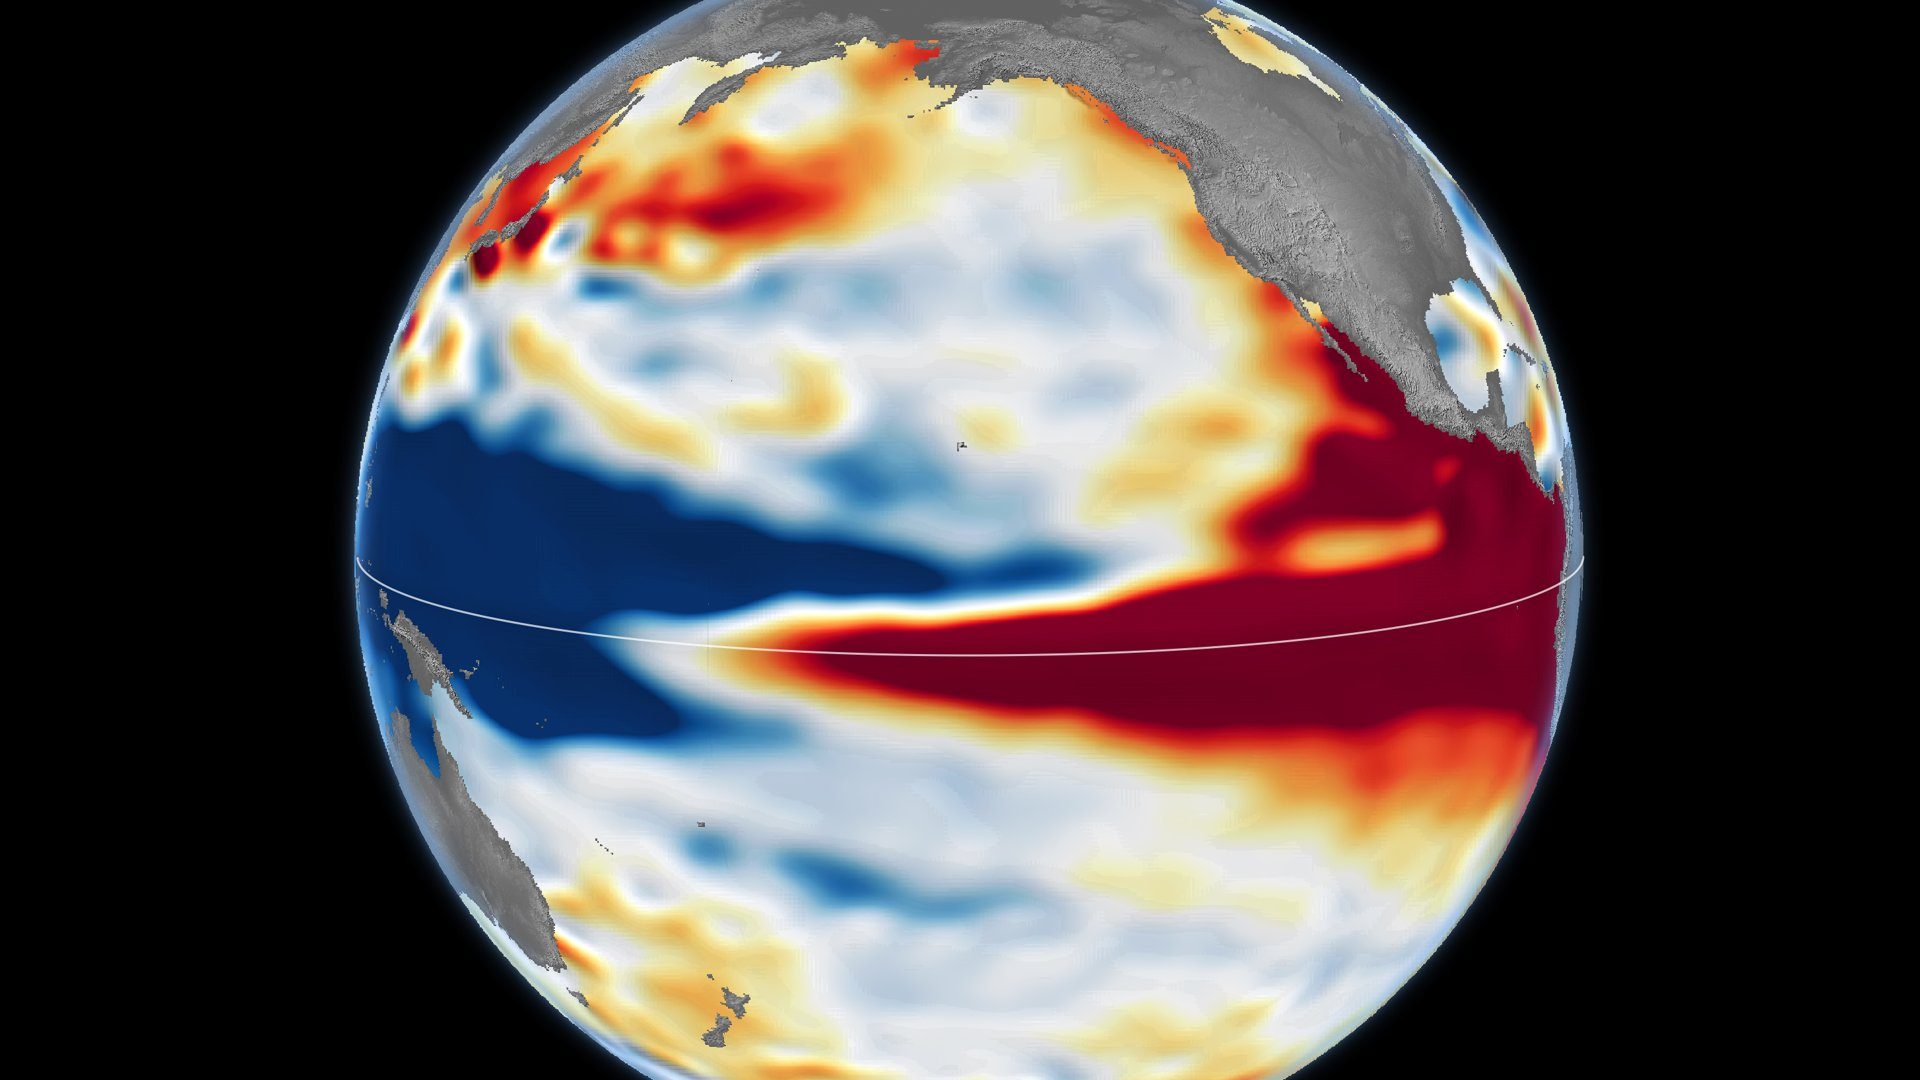
Satellites can spot an ocean warming without touching it. They measure the height of the sea, because warm water expands and lifts the surface.
What happened
NASA Earth Observatory published two sea-surface-height maps of the Pacific side by side. One is dated 13 October 1997 and uses data from the TOPEX/Poseidon satellite. The other is dated 12 October 2026 and uses data from Sentinel-6 Michael Freilich.[1]
NASA says the current pattern "closely resembles October 1997."[1]
Separately, the NOAA Climate Prediction Center has an El Niño Advisory in effect, according to its diagnostic discussion of 8 October 2026.[3]
Why it's surprising
The maps look like heat maps, but they are not. They show height.
On the NASA maps, shades of red mark where sea levels were higher than average. Normal sea level appears white, and lower areas are blue.[1]
That height reaches further than a thermometer at the surface. NASA says sea height "goes beyond surface temperature measurements to indicate how much heat is stored in the subsurface."[2]
How it works
NASA explains the starting point simply: "When ocean water warms, it expands in volume and causes the sea surface to rise." Satellites measure that height from orbit.[2]
In normal conditions, trade winds keep warm water piled up in the western Pacific, where it stands higher than in the east. During El Niño the winds weaken, or in some cases start blowing the other direction, and the warm water moves east.[1][4]
NASA describes every El Niño as growing from a feedback loop between the atmosphere and the ocean. NOAA notes that the El Niño–Southern Oscillation influences temperature and rainfall across the globe.[1][4]
Why it matters
A similar map is not a forecast, though. Josh Willis, quoted by NASA, said the resemblance "doesn't mean it will be exactly the same."[1]
Similar maps do not guarantee the same weather where any one reader lives.
Our readBecause a raised sea surface signals heat stored below, height maps give a view of El Niño that surface temperature alone does not. That makes them a useful way to compare this event with past ones, such as 1997.[1][2]
What's confirmed and what isn't
Confirmed: warm seawater expands and raises the sea surface; the two maps are dated 13 October 1997 and 12 October 2026; NASA says the patterns closely resemble each other; and NOAA has an El Niño Advisory in effect.[1][2][3]
Not covered here: exact sea-height values in centimetres, water temperatures, whether this El Niño will be a record, or any local weather forecast. The map colours show height only, not temperature.
Both NASA articles come from the same organisation. The NOAA sources are cited for El Niño's status and for how El Niño works.
- Not claimedNo centimetre values for sea height are given.
- Not claimedNo water temperatures are given.
- Not claimedNo claim that this El Niño is or will be record strength.
- Not claimedNo local weather forecast is made.
- Not claimedThe maps are not temperature images; they show sea height only.
- Not claimedA similar map to 1997 does not mean the same weather or the same outcome.
- Not claimedNo endorsement by NASA or NOAA is implied.
Sources
- NASA Earth Observatory — El Niño Then and Now, 2026-10-23Primary
- NASA Earth Observatory — El Niño Is Underway, 2026-06-18Primary
- NOAA Climate Prediction Center — ENSO Diagnostic Discussion, 2026-10-08Independent
- NOAA climate.gov — ENSO in a nutshellIndependent
6 claims checked against these sources; 6 confirmed.
Spot an error? Request a correction.
Video transcript
Satellites can spot an ocean warming by measuring its height.
When seawater warms, it expands. That lifts the sea surface.
These maps compare October 1997 with October 2026.
Red means the sea stands higher than average; blue, lower. It's a height map, not a temperature photo.
Normally, trade winds pile warm water in the west. During El Niño, they weaken, and the warm water shifts east.
Ocean and atmosphere then feed each other, reshaping rainfall far away.
This year looks a lot like 1997. But similar maps don't guarantee the same weather where you live.
The surprise is what lies below: because warm water takes up more room, the sea's height reveals how much heat is stored beneath, not just at the surface.
Production note: The sea-surface-height maps are by NASA Earth Observatory / Lauren Dauphin, using altimetry data from NASA/JPL-Caltech, and are shown unaltered. The ocean cutaway is an original schematic animation, labelled not to scale and not NASA footage, and the narration voice is synthetic.
What else changed
 Future Technology2 min readNº 009This Touchscreen Is Woven Into a SleeveResearchers in Singapore built 54 touch-sensing fibers into a sleeve to make a 96 × 54-pixel display. After 50 washes it was nearly unchanged. It is still a lab prototype.Read story
 Space & Science2 min readNº 010One Particle of Antimatter, Held for MonthsPhysicists at Northwestern University have held a single positron, the electron's antimatter twin, in a magnetic trap for months. They can now watch it climb one energy step at a time.Read story
 Space & Science2 min readNº 007Moon Trash Could Become Tomorrow's Spare PartsAn MIT student team won first prize in NASA's LunaRecycle Challenge with a system that grinds discarded packaging and molds it into composite parts. The foam usually thrown out becomes part of the material.Read story